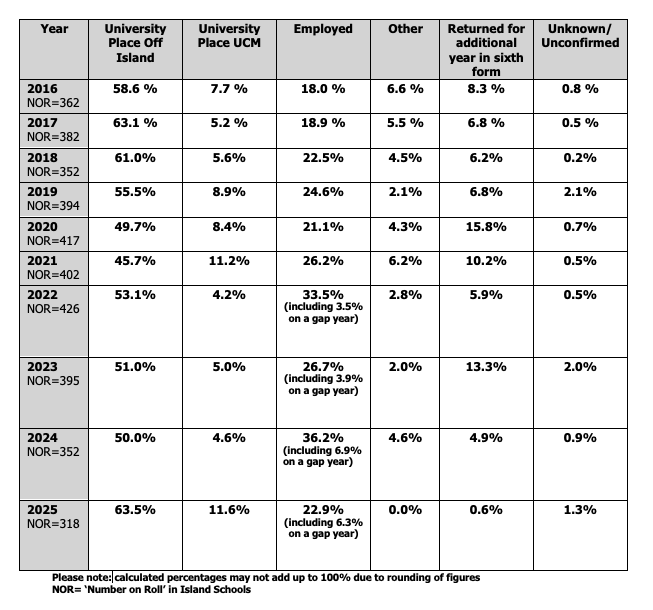
Destinations of IOM Schools Year 13 Leavers (18 year olds)
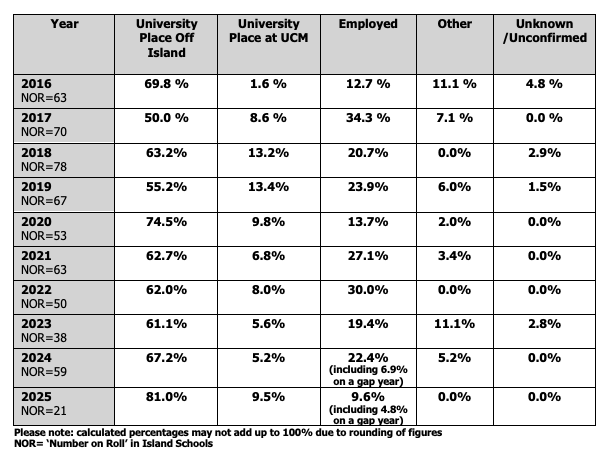
Destinations of IOM Schools Year 14 Leavers (19 year olds)
DESC Careers Information, Advice and Guidance Service
Destinations of IOM Schools Year 13 Leavers (18 year olds)
Destinations of IOM Schools Year 14 Leavers (19 year olds)